I'll admit, it's hard not to think referees are biased when an opposing defender deliberately uses his hand to stop a ball in the box and two referees looking directly at the incident fail to award a penalty, which contributes to Celtic losing the game and a chance at the treble!
There are countless other incidents and decisions that have gone against Celtic over the years. According to some supporters, these examples constitute a body of evidence in support of the view that referees in Scotland are biased against Celtic.
But anecdotes such as these are hardly objective evidence, and there is always the potential for confirmation bias in the use of such anecdotes.
Fortunately, there is ample publicly available data on Scottish referee decisions at sites like football-data.co.uk. So we don't have to rely just on anecdotes; we can assess the patterns rigorously and quantitatively with analytics.
I will focus in this post on fouls because awarding fouls is the most frequent referee action. As such, fouls give us the best opportunity to detect bias (signal), as opposed to random variation (noise). Bottom line: if we can't find evidence of referee bias in fouls, we are unlikely to find it in cards or penalties, which have much smaller sample sizes.
The metric I will focus on is Fouls Ratio, or
Fouls Conceded/(Fouls Conceded + Fouls Awarded).
Teams that tend to conceded more fouls than their opponents will have higher Fouls Ratios than teams that tend to concede fewer fouls. Note, there is no single expected value for Fouls Ratio, such as 0.50. The value will depend on the strategies, tactics, and discipline level of each team.
Now for the obligatory colorful charts.
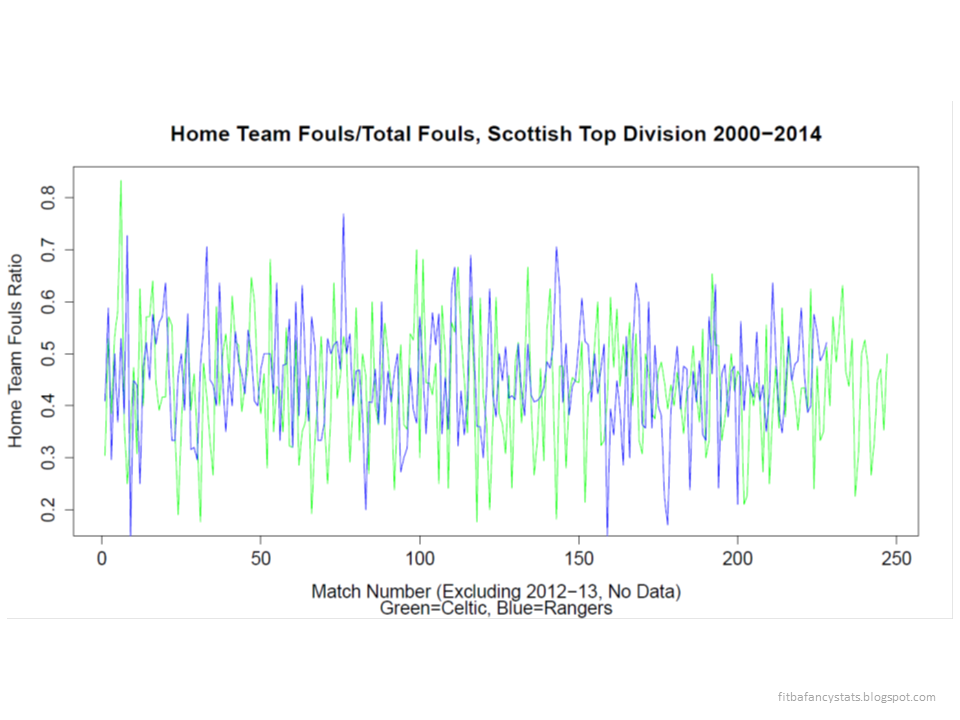
Figure 1
 |
| Click to Enlarge |
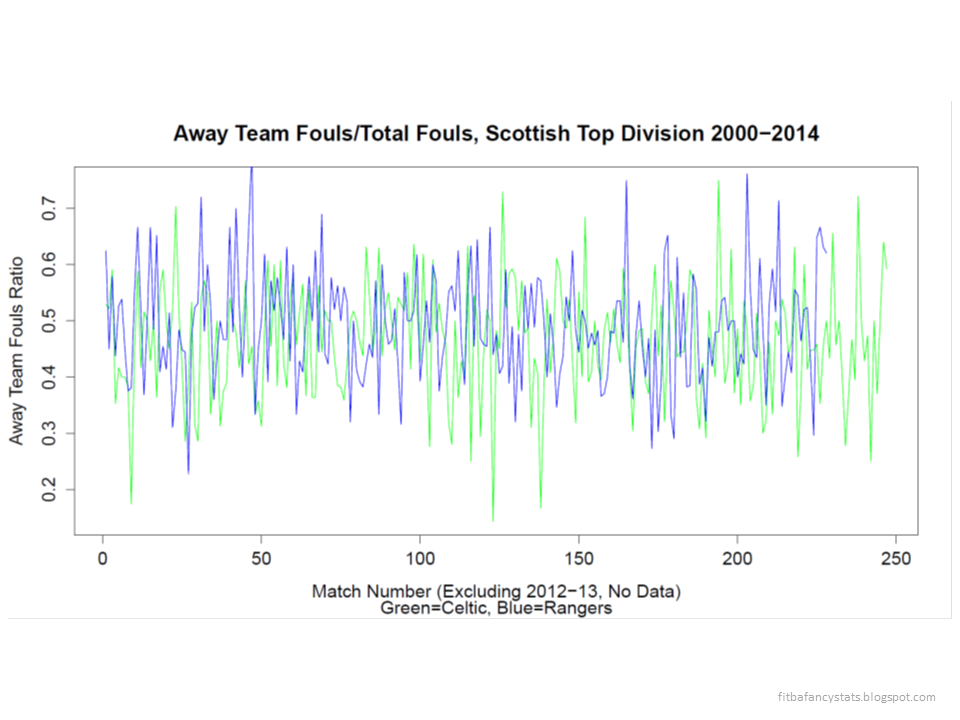
Figure 2
 |
| Click to Enlarge |
Figures 1 and 2 plot the Fouls Ratio for each league match for both Celtic and Rangers going back to the 2000-01 season. As you can see, whether the match is home or away, the pattern looks completely random, no discernible trends or predictable oscillations.
Also notice that the lines overlap substantially between Celtic and Rangers. The mean Fouls Ratios for Celtic, home and away, are 0.44 and 0.47 respectively, compared to 0.45 and 0.49 for Rangers. These relatively minor differences are nonetheless statistically significant in the case of away matches.
Thus, if anything, referees appear to be biased against Rangers, not Celtic. However, I suspect these differences reflect real differences in discipline between the two clubs, rather than referee bias. It's important to note also that both Celtic and Rangers have below average Fouls Ratios compared to the league as a whole (pro Old Firm bias anyone?).
So there doesn't appear to be a detectable bias against Celtic in fouls overall, but what about individual referees?
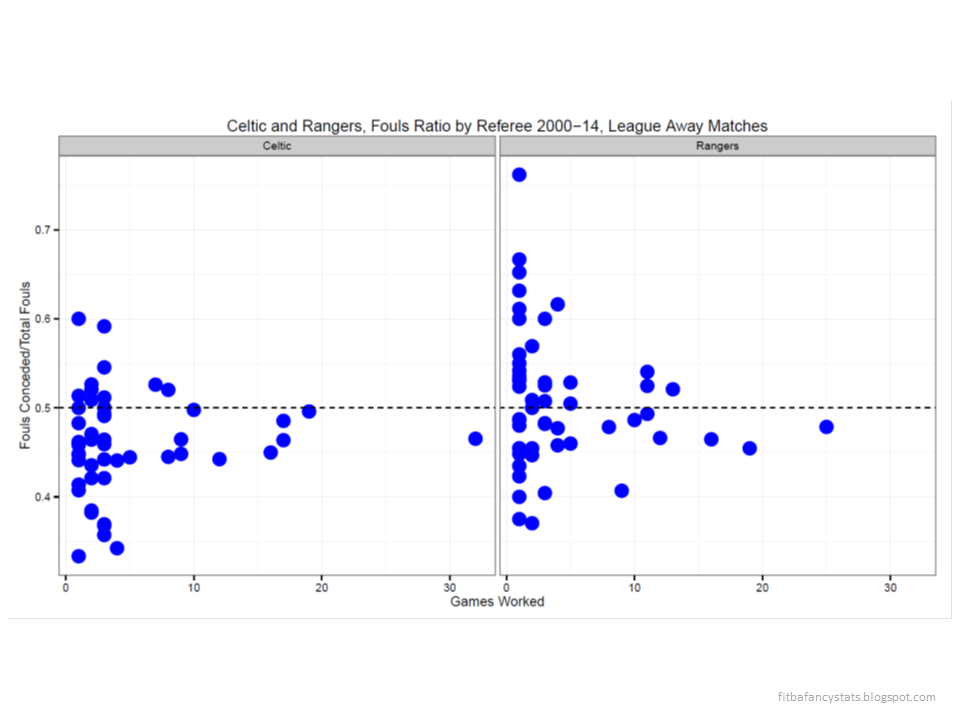
The next two charts plot Fouls Ratios for Celtic and Rangers by referee while taking into consideration the number of games each referee has worked. The number of games worked is essential information because random variation in Fouls Ratio is expected to decrease as the number of games increases. Indeed, this appears to be the case.
Figure 3
 |
| Click to Enlarge |
Figure 4
 |
| Click to Enlarge |
As you can see from the charts above, Fouls Ratios tend to converge to a similar value for both clubs as the number of games a referee has worked increases. This is an example of regression to the mean. No individual referee biases can be detected in these plots for referees that have worked 10 or more games. All of the referees tend to converge on a single value, which is the mean Fouls Ratio for the team, be it Celtic or Rangers.
It's interesting to note that because of typos in the source files, some of the data points represent the same referee (i.e., Hugh Dallas, H Dallas). Because of these data entry errors, we can clearly see how Fouls Ratios regress to the mean as the number of games worked increases.
Take-home message: there is no detectable evidence of bias against Celtic by referees in Scotland, at least in regards to the proportion of fouls conceded in league matches between 2000 and 2014.
While there may be some referees who hold personal biases against Celtic, or other clubs, these biases do not appear to influence their behavior on the pitch in any reliable way.
Moreover, given the randomness of variation in Fouls Ratio over time, it appears that refereeing decisions do even out in the long run.
Loving your work mate but I would doubt fouls would be any Celtic fans chosen variable to analyse for detection of bias. How about a look at penalties given where decision to award the penalty impacts on on the match? Even if the sample is smaller I'm sure the chart would look interesting. Maybe just let them know someone is watching to encourage some mean reversion now secco getting added to ranger's stats by some!
ReplyDeleteI am pro secco
DeleteLoving your work mate but I would doubt fouls would be any Celtic fans chosen variable to analyse for detection of bias. How about a look at penalties given where decision to award the penalty impacts on on the match? Even if the sample is smaller I'm sure the chart would look interesting. Maybe just let them know someone is watching to encourage some mean reversion now secco getting added to ranger's stats by some!
ReplyDelete